Best Careers for Personality Types

This was shared with us by Emily Parker of CollegeMatchUp.net.  Today, many job assistance organizations and career counseling centers will factor in a person’s Myers-Briggs personality type when helping them find the ‘perfect’ job. Find your type below and you will see a few suggestions to get you started in finding a role that can best fit your specific disposition.  Remember, these are general terms and suggestions presented, as opportunities abound and you’re not necessarily limited to what’s listed!  Below the infographic the 16 MBTI types are listed and identified!

PersonalityTypeJobsPost

ISTJ

These types are good work horses, as they get things done. They see every detail of a plan and aren’t afraid to spend extra hours at the office or take on extra work. To compensate, they seek out jobs with high rewards.

Nickname: The Duty Fulfillers

Prevalence: 8.5%

Perfect careers: Business administrator, police officer, lawyer

ESTJ

These are the defenders of our society. They seek out jobs in which they can feel accomplished and important, as well as helpful.

Nickname: The Guardians

Prevalence: 13%

Perfect careers: Military officer, teacher, sales representative

ISFJ

Like the ESTJs, these types are supportive, but in a much more nurturing, caring way. They feel things intensely and like to help others through difficult situations.

Nickname: The Nurturers

Prevalence: 7%

Perfect careers: Interior decorator, social worker, childcare

ESFJ

Full of empathy, ESFJs seek employment in places where they can connect with their client, student or patient. A high amount of these types are in the nursing and teaching fields.

Nickname: The Caregivers

Prevalence: 12%

Perfect careers: Nurse, counselor, teacher

ISTP

These types look at a problem from absolutely every angle. They like to problem-solve and believe there are multiple ways of finding solutions.

Nickname: The Mechanics

Prevalence: 6%

Perfect careers: Forensic pathologist, computer programmer, engineer

ESTP

ESTPs are the “go-getters” of the personality types. They are high-energy and enjoy friendly competition. They work well in fast-paced environments that are challenging and rewarding.

Nickname: The Doers

Prevalence: 10%

Perfect careers: Marketing, paramedic, athlete

ESFP

ESFPs crave the spotlight. They are very creative and thus stay away from jobs that require strict routines or office work. They like to travel, to design and to express themselves.

Nickname: The Performers

Prevalence: 11%

Perfect careers: Artist, fashion designer, consultant

ISFP

Like ESFPs, ISFPs are creative, though in a much more introverted way. They tend to choose jobs that require imagination and originality, but they’d much rather work in solitude.

Nickname: The Artists

Prevalence: 6%

Perfect careers: Musician, photographer, veterinarian

ENTJ

Born leaders, ENTJs are risk-takers with sharp wits. They can make firm decisions and never feel regret. They are best in charge of large accounts, corporations or business decisions.

Nickname: The Executives

Prevalence: 4%

Perfect careers: Corporate executive, entrepreneur, judge

INTJ

These types are the thinkers. They can solve complex problems and enjoy doing so. Most are in a STEM (science, technology, engineering, math) field.

Nickname: The Scientists

Prevalence: 1.5%

Perfect careers: Scientist, engineer, corporate strategist

ENTP

ENTPs like to solve potential problems, and they are often looking toward the future. They connect well with people and they like to work in teams on complex issues.

Nickname: The Visionaries

Prevalence: 4.5%

Perfect careers: Psychologist, actor, systems analyst

INTP

Like The Scientists, INTPs do well in STEM fields. But they also enjoy scripted public speaking and teaching, as they enjoy sharing what they find with others.

Nickname: The Thinkers

Prevalence: 2.5%

Perfect careers: University professor, mathematician, forensic research

ENFJ

ENFJs enjoy doing volunteer work and helping others. They are also good at organization and do well planning events and parties.

Nickname: The Givers

Prevalence: 4%

Perfect careers: Clergy, events coordinator, writer

INFJ

ESTJs are The Guardians, but INFJs are a bit more prone to choose careers that offer small victories. They don’t want to save the planet, they just want to make the world better one person at a time.

Nickname: The Protectors

Prevalence: 1%

Perfect careers: Chiropractor, early childhood development, dentist

ENFP

These types like to be surrounded by other creative types. They thrive on others’ energies and enjoy being a part of creative, political or social movements. They’re also perfect leaders with great communication skills.

Nickname: The Inspirers

Prevalence: 7%

Perfect careers: Politician, television reporter, writer

INFP

INFPs can be perfectionists, but this usually benefits them in their careers. They see only one solution per problem but work very hard to reach that solution.

Nickname: The Idealists

Prevalence: 2%

Perfect careers: Psychiatrist, social worker, teacher

Author-Box


The Ruse of the Unemployment Numbers

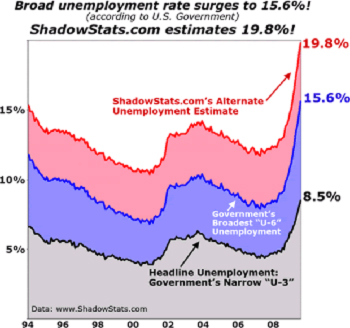
US UnemploymentHungry? Imagine being served your multi-course dinner by a Ph. D. in Pharmacology, or getting your burrito delivered by an experienced human resources professional. Both of these scenarios are very real. Both of these individuals, one a friend, the other an acquaintance, lost jobs due to economic downturns at their respective organizations and both have taken jobs, simply to pay the bills, while they seek out new opportunities in their chosen professions.

Both of these individuals are examples of many that have succumbed to a massive, but hidden, problem called underemployment. Watching falling unemployment numbers now being reported below 6%, down from nearly 10% four years earlier is, in many ways, simply misleading.

I believe it was Mark Twain who quipped, “statistics are like an alienist; they can work for either side.” The ‘official’ unemployment rate (technically called U3) is a simple and broad measurement that divides the number of people who are not working, want to work, and have been actively applying for jobs by the sum of the people working and those loosely defined as unemployed. In doing so, today, you get a number that’s just below 6% as stated above. While many seem to accept this as THE measurement of employment health, this is merely one measurement though; The unemployment rate can be calculated using a variety of differently ‘useful’ parameters and the U3 rate leaves out many that should be included as they are in the U6 statistic (see below).

With the Fed preparing to raise interest rates as soon as they believe the labor market is strong enough, determining that strength is difficult. But one fact everyone should be able to reasonably agree on is that the ‘official’ unemployment rate does not even attempt, and can’t really, measure the actual strength or health of the labor market exemplified by the openly known fact that Fed Chair Janet Yellen looks at a “dashboard” of at least nine labor market indicators!

Thus, lots of people who are unemployed by many reasonable definitions may not count as such, depending on the metrics used, in the official government statistic. In fact, using the government’s own definition, workers who are discouraged or marginally attached to the labor market do not count in the official unemployment rate. There are different, broader, unemployment measures available, but they do not get the headlines.

In fact, of the over 90 million Americans 16 years old or older that are not working, hence not part of the equation, fall into several categories: retirees, stay-at-home parents, students, and those who would prefer working but have given up on finding a job. Policy makers have been reduced to making educated guesses about the relative size of each subgroup of those not working because the capture of the actual numbers is speculative at best, and then their potential to reenter the labor market as conditions improve remains in question too.

Despite the significant decrease in the official U.S. Bureau of Labor Statistics (BLS) unemployment rate, the ‘real’ unemployment rate is most likely over double that approaching near 13%. This number, which is a better portrait of the nation’s REAL economic health, reflects the government’s U-6 report, which accounts for the full unemployment picture, and this includes those that are marginally attached (describes individuals not currently in the labor force who wanted and were available for work)to the labor force, plus those “employed part time for economic reasons.” In July, this marginally attached group accounted for 2.2 million people. To put that in perspective, there are currently 16 states in the U.S. with populations smaller than 2.2 million. Another number, large in and of itself is the 741,000 discouraged workers – workers not currently looking for work because they believe no jobs are available for them. These are included within the list of marginally attached people. Another 7.5 million were not considered unemployed because they were employed part-time for economic reasons. Those people are also called involuntary part-time workers – working part-time because their hours were cut back or because they were unable to secure a full-time job.

Unemployment is really a measure of labor market disequilibrium; it measures the mismatch between employers’ demand for labor of various types and workers’ willingness and ability to supply that labor. Unemployment that is “too high” or “too low” in aggregate, or in specific job categories, is really about these mismatches, not the overall health of the labor market.

Author-Box

What’s Missing in the College Experience? Part 3 of 4

A stands for 'average!'

A stands for ‘average!’

Part 3 of “What’s Missing in the College Experience” – Everyone’s Getting A’s

There has been an over-saturation of high grades in the academic world lately. I am not nearly the first to write about the subject; the phenomena has caught the attention of many school administrations as well. The truth is that, statistically, most people are average. Most people fall near the middle of a bell curve, but many college professors have been awarding a disproportionate number of A’s to students. The prevalent culture dictates that if you don’t have A’s across the board, you aren’t a good student. This plays heavily into an unrealistic expectation for students of how the world will react to them, and overall it hurts their levels of success in the working world.” (Eli Lisseck ’13)

I don’t think that it’s been any secret in terms how ‘academic creep’ has seeped into our educational institutions. It has certainly been not an isolated manifestation as democratization has worked its way into the fabric of many parts of society; trophies awarded for showing up, everyone on the field getting a ball, surveys (see below) really becoming a simple pass/fail response instead of recognizing shades of grey, etc.

In terms of academia, it has been an increasing trend creeping through the college campuses and taking over the academic culture in a slow, and steadily upward way. Even reaching the Ivy Leagues with the most recent, and perhaps the most publicized showcasing in the news being Harvard and how grade inflation, or the expectation thereof, has become the new rule. In Harvard’s case in particular, the ‘average’ grade is reported as being an ‘A’ with the median grade being an ‘A minus.’ Turns out one of the nation’s most ‘rigorous’ academic programs is also one of the nation’s most lenient graders.

Now how is this even possible you ask? In fact, it is, and should be, statistically impossible for if you were to look at a bell curve, there should be an appropriate distribution of each grade, A through F with the average award being somewhere in the middle near the C range. So, whatever the rumors were about C being average, apparently that’s not the case anymore.

Currently, as an A has become the new C on students’ transcripts, it brings the question to mind, what does earning an ‘A’ even mean anymore if they’re being given out like confetti? I wrote in a previous post about an increase in employer skepticism as they have the luxury in today’s economy to really put the lens of scrutiny on potential candidates in the hiring process. It has changed the hiring process in that there’s nothing really to differentiate a candidate today if you simply look at one’s transcript and academic history; everyone is stellar, spectacular and an A-level scholar. So when an A used to mean that a student was putting in the sweat-equity to earn that mark, now it is looked upon as merely an automatic, an expectation on the employer’s part, so, again, if everyone has one, what is its real value? And if it doesn’t reflect exceptionality, what does?

Further, according to a December Washington Post article, nearly 41 percent of undergraduates obtain a grade of A- or higher, while only 5 percent of undergraduates are receiving grades of C or less, nationally. Again, this is a statistical impossibility of the true bell curve’s measurement of students as a group and, what the grade inflation obviates is, that colleges are losing their grasp on how to gauge students’ work and the ramifications attached to that.

There is a two-fold factor that has contributed to grade inflation making its creep in our nation’s colleges and universities. One is mainly because employers want the ‘best’ students and so it stands to reason that they want to see A’s. If a student receives an A then they must be good. Secondly, in combination with this, generally professors want to help their students and in addition they simply want to be liked, which is perfectly understandable but in an overarching way, in helping, they are hurting.

For an employer who’s hiring on-campus, and A means exceptional, and that’s all they’ll see in the moment. They’ll just see that A, of that student, in that moment which, hypothetically, was awarded to that individual student for his/her perfect competence in Corporate Finance or something of that ilk. They are, or I should say were, unaware that the grade they coveting, could essentially be offered by any student they are to meet.

It reminds me of a recent (analogous) interaction I had when bringing a Volvo in for service. I had the work done, paid the bill and left. Afterwards, I was asked to complete a survey on my ‘experience’ as everything is now an experience. I agreed and the survey was a typical 1-10 sort, meaning 1’s get everyone fired and 10 is exceptional!

Or so I had assumed. In thinking about my ‘experience’ and also thinking it good; I’ll give 7’s & 8’s as I thought it fair and representative of their work. For reference, to me a 1 is either losing the car I came in with or breaking something, making it worse AND charging me for it, while a 10, on the other hand, would be when the work is done for free along with a paid trip to Tahiti!

In any case, shortly after seeing the 7’s & 8’s I recorded on the survey I received a call from the dealer’s “Crisis Team” to mitigate this catastrophe….

They asked me “what was wrong and why was I dissatisfied?”

I said “I wasn’t at all.”

They said “well if that’s the case, then we really aspire to receive 10’s on the survey.”

So, I asked, “if that’s the case, why did you not qualify that to begin with and if so, then what does the 1-9 on your survey really even mean?”

They told me that “anything below a 10 was a failure and they would seek to rectify such.”

That didn’t really answer my question so I again said, “essentially what’s the point of 1-9 then? Shouldn’t it just be pass/fail instead if you’re not allowing for an gradation in the evaluative process? I stated that I was happy with the work, it wasn’t a binary situation of either a 10 (happy) or everything else (sad). I wasn’t willing to just simply give 10’s and if you’re wanting to view this as a ‘failure’ then that is your option to do so.”

Getting back to the issue at hand, academics, the real solution, and the more difficult one, like the service issue I just reflected on, is to deflate the grade nationally across the spectrum. Allow for the shades in between a simple pass or fail structure. Faculty, managers, supervisors, whatever the case may be, must grade throughout the spectrum and be willing to give D’s and C’s for average work, and students must once again feel the need and work hard for the almighty A. If this is the case then the A can once again achieve something in it’s real meaning; being exceptional!

Author-Box


Being a New College Graduate Means You are…

Pew Economic Report for New Graduates

Pew Economic Report for Young College Graduates

Facing an unprecedented amount of debt – According to The Institute for College Access and Success (TICAS) Project on Student Debt two-thirds of the graduating class have debt waiting for them at door after graduation with the average borrower graduating approximately $26,600 in the red. In total, student loan debt is amounting to over $1 trillion. $1.2 trillion to be more specific. Think of that number for our new graduates entering the workforce and the economy as a whole. Of this $1.2 trillion in student debt, about $1 trillion is in federal student loans. This figure does not tell the full story, however, as the $1.2 trillion does not include funds students must divert away from retirement savings, parent borrowing, or credit card debt. While a tie for federal student loan interest rates to the market is of some help, lowering the current rates for undergraduate students from 6.8 to 3.8%. But if and as the market climb, these rates will also climb until they reach a cap of 8.25%.  By TICAS calculation, this may cost families $715 million more over the next 10 years.

What does the lower number of 3.8% interest actually translate to for students? If we go back to that average figure of $26,600, compounding for interest year over year using the 10-year-payback plan that is the standard, the total cost of your $26,600 loan is now closer to $40,000.  Break that down by monthly payments and you are looking at about $320 per month going toward student loan payments.  In the end, the opportunity cost of the education itself is almost $40,000 in addition to what’s already been out of pocket for tuition, room, board, books, food, etc.  Every dollar now owed is a dollar delayed in terms of the down payment on a house. Money put aside for retirement or investments.  Dollars sacrificed for the next generation’s needs.

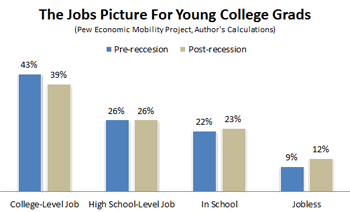
Facing an improved economy but – for every position offered by an employer, not only are the new grads in competition with each other, but facing increasing numbers from laid-off, displaced and/or career changing job-seekers that, in addition to a college degree, offer a tangible employment history and applied experience. With that new competition, increasing numbers of recent college graduates are ending up in relatively low-skilled jobs that, historically, have gone to those with lower levels of educational attainment. This is having a push-down effect where those with only a high-school degree are now being displaced by college graduates.

In fact, the proportion of ‘over-educated’ workers in occupations appears to have grown substantially; for example in 1970, fewer than one percent of taxi drivers and two percent of firefighters had college degrees, while now more than 15 percent do in both jobs; The figures are based on an analysis of the 2011 Current Population Survey data by Northeastern University researchers. They rely on Labor Department assessments of the level of education required to do the job in 900-plus U.S. occupations, which were used to calculate the shares of young adults with bachelor’s degrees who were “underemployed.”

About 1.5 million, or 53.6 percent, of bachelor’s degree-holders under the age of 25 last year were jobless or underemployed, the highest share in well over a decade.  In 2000, the share was at a low of 41 percent, and this was when the dot-com bust erased job gains for college graduates in the telecommunications and IT fields.  The result is that if you look at employment broken down by occupation, young college graduates were heavily represented in jobs that merely require a high school diploma or even less.  The barista serving you coffee with the Ph.D is no longer an urban myth.

Faced with ‘new’ employer skepticism – As more and more news reports and pundits attempt to explain the plight of current prospects for new graduates, another, new-ish court is being heard from more and more; the employers.  They say that college students, in general, are entering the workforce, or trying to, with a double whammy working against them; coming in the door without the skills needed to hold down or perform a job AND, in addition, unrealistic expectations about the job itself and the requirements the employer is needing. This means that in a soft job market like we’re now experiencing, recent graduates are facing not only stiff and varied competition from experienced workers re-entering the workforce but also new, budding skepticism from the employers with the (limited) jobs on offer.

According to Inside Higher Ed, more students have struggled to make their mark in a depressed job market and this has raised the obligatory questions about the intrinsic employment value of a college degree?  In the same correlative breath has the concern that new graduates are not equipped to function in the work place and are not meeting employers’ expectations and needs.  A new survey reaffirms that quandary.  In the report, “Bridge That Gap: Analyzing the Student Skill Index,” only half of college students said they felt very or completely prepared for a job related to their field of study. In contrast, and perhaps even more telling, even fewer employers – 39 percent of those surveyed – said the same about the recent graduates they’d interviewed in the past two years.  The fact of the matter is that the latter percentage, whether real or perceived, is the benchmark as they, the employers, are the ones hiring.

The most ‘educated’ but the least well prepared – As the more scrutinizing lens of a poor economy starts to look for answers, many have argued that colleges and universities aren’t doing enough to prepare their students for the work force.  This is true; sort of…  I would have to agree with that assessment and I don’t mean in a way that condemns the educational institutions’ intentions.  The problem is that the ‘system’ is not built where the idea of higher education and its synthesis of development and ’employ-ability’ are best intertwined.  In most cases, for example, representative career service offices tend to be an isolated campus entity.  Either an overbooked office that doesn’t have the resources and staff time to effectively work with students navigating their career path OR an office that can go underutilized or flat-out ignored by the campus community.  I’ve seen and experienced both and both are a disservice to the very client’s they try to serve.  In the past couple weeks I have spoken with several soon-to-be graduates and the common question asked is “have you been to your campus career center?” Invariably, the answer seems to be either ‘no’ or ‘yes, but only one or two times.’

What’s missing is that colleges need to be systemically embedding career development into the fabric of the undergraduate education.  This is a difficult task as many a faculty department will fight the ‘vocation’ label and/or expectation tooth & nail.  This is changing as new members replace the incumbents understanding the new economy and its demands but it is a slow evolution at best.  If this were to come to fruition, an organic and institutional embedding of course and career, not only would this better prepare students for life after college, it would help to justify the value of a liberal arts degree, or any degree for that matter especially as outcomes are becoming the new quantitative rage.  

To qualify, this post is not meant to simply and merely highlight the negatives facing our soon-to-be-freed graduating class, but instead to shed some light on the realities being faced, not just by the current generation, but all generations as there is a systemic, ripple-effect that reaches out and affects us all.

Author-Box

When Does the Interview Actually ‘Begin?’ Part 1

Watch what & when you speak!

Watch what & when you speak!

As we approach nearer the end of the spring semester, graduation looms for the nation’s college seniors.  This leaves many new potential entrants of the job market starting to examine and prepare for this annual transition and individual rite of passage.

The impending interviews will be out there waiting for many that have started to plant some seeds in their job search.  With that, the talk about when and where the interview actually begins becomes a topic for many career professionals and pundits.  Many say it is when you arrive the obligatory 10 or 15 minutes early before your slated time-slot.  Some say it’s once the handshake has taken place and a welcome into the office has been given. Many theories and opinions are bandied about.

Frankly, while all can be ‘true’ for the interview proper; the actual sit-down, face-to-face with your interviewer, the ‘rules’ for such, can be a bit misleading.  Anything that transpires within the actual framework of the interview, no matter how good, can be undone in a heartbeat after such when the employer starts to put in a little time to research your candidacy, with intent or not, and what you need to understand is that as a new job seeker, and for the future, your interview definitely does not start when you show up for a meeting! What many people fail to realize is that interviews begin even before the moment of contact is made with an organization as evidenced by the anecdote to follow.

When I was Director of Recruiting and Employer Relations for Mount Holyoke College’ Career Development Center there were many instances, but one in particular, when this really came to light.  We had a great recruiting program and many organizational and corporate ‘heavy-hitters.’ On this given day, one of the recruiters, who was from PriceWaterhouseCoopers, was up from NYC for a day of interviewing on-campus.  He had a full-day’s roster and was ready to vet some aspiring students.

In hearing he was to be on-campus for the day, his sister who was in the area and also happened to be an alumna of Mount Holyoke, had agreed to grab lunch together during his interviewing schedule break.  On a full-day 12 to 13 interviews could be conducted by a recruiter and our campus’ recruiting program was also open to other colleges in the area as we shared opportunities collaboratively.

On this day, like many other days, an aspiring senior from one of the neighboring institutions was on the interview roster and he just happened to be scheduled for the 11:30 slot just before the lunch break.  He did all the proper things for his interview. Was appropriately dressed, researched and well-prepared.  Was even about 20 minutes early before his interview and was planning to sit quietly and wind-down, which he did.

At 11:30, he met the interviewer, went in and ‘hit it out of the park!’  Great interview!  Great candidate!  Seemed really interested and knowledgeable and in addition, one who really wanted and was willing to learn.  Perfect, right?  The interview ends, he thanks his interviewer and off he goes as is practice.

In the interim, as the interview was being conducted, the PWC rep’s sister had also come a little early to meet her brother for lunch. While sitting there, she saw the candidate come out of the office and she hasked her brother, “did you just meet with him?”

He said, “yes, great, great candidate. Really nailed it.” “Why?”

Then she told him….

What no one realized at the time was that while he, the candidate, was walking across campus to get to the career center for his interview, on-time yet, he was chatting with his friend the whole way.  During this ‘chat,’ he had nothing good to say about this particular organization or the field in general and was just complaining the whole way about having to ‘work the machine.’
As she was scheduled to meet her brother for lunch and, also heading over early, she happened to be right behind this candidate AND his friend listening to the whole conversation along the way! She didn’t realize the context or the connection in the moment and he was unaware that forces in the world are indeed around him.

So, when she saw him come out of the interview, she connected the dots and put it all together; guess what she told said recruiter?  Yep, you guessed it!  She relayed all the negativity coming out of him that she heard on the way over to the interview.  Sadly, as great a candidate as he was, his chances of joining with that organization ended in that very moment!

Needless to say, he never did get that role or join PriceWaterhouseCoopers back then.  Sadly, also, was that he never knew the reason why an offer nor a continuation of consideration was not extended as many employers, even more so now, are reluctant to say anything in terms of feedback or criticism.

I thought this was a ‘teaching moment’ (I really dislike that term/buzz phrase) so I did later follow up with him to try to offer some clarity on the issue and the circumstances in particular which he was both oblivious to and very thankful for.  If nothing else, I am confident that he realized that the process can be much larger than it seems and the ‘six-degrees’ of separation are out there, watching you, working either with you or against you.  It’s up to you to decide how much help or hindrance they are to be though as every action, motion and on-line post is being watched and part of the over-all evaluation!

To all the aspiring new graduates, recent graduates and Millennials in general, keep the path traveled well-groomed and clean behind you as it will clear what’s in front of you too!

Author-Box